
The Allan Gray Balanced Fund launched in October of 1999 with a unit price of R10, offering retail investors access to a diversified, multi-asset class, long-term growth strategy. The Balanced Fund was designed to provide investors with equity-like long-term real returns, but at lower levels of risk. Looking back over the Fund’s 25-year history, Nick Curtin discusses why it continues to be the ideal choice for retirement fund members looking for a unit trust that complies with the retirement fund investment limits, as well as for any investor seeking a stand-alone long-term diversified growth portfolio.
While some investors prefer to use a “building-block approach” when constructing their portfolios, making asset allocation decisions independently, we have always believed that using a holistically managed global balanced fund is a more effective way for most investors to manage their long-term investments. By “effective” we refer to the complex interplay between risk and return in portfolio construction – a skill set that we have been refining for the last 51 years across several generations of Allan Gray leadership. The Allan Gray investment philosophy is anchored in the understanding and management of risk. This guides our integrated global multi-asset class capability, supported by a client-centred organisational design.
The Allan Gray Balanced Fund (the Fund) has created significant value for investors since its inception in October 1999, delivering an annualised return of 14.8% versus a peer group average of 11.4%. While the difference of 3.4% might not seem like a lot, its impact on rand outcomes is massive when compounded over a 25-year period. As shown in Graph 1, a lump sum investment of R1 000 in 1999, with subsequent income distributions reinvested, would have grown to R32 561 by November 2024. This is more than double the R15 306 that its peer group (the market value-weighted average return of funds in the South African – Multi Asset – High Equity category excluding Allan Gray) would have achieved.
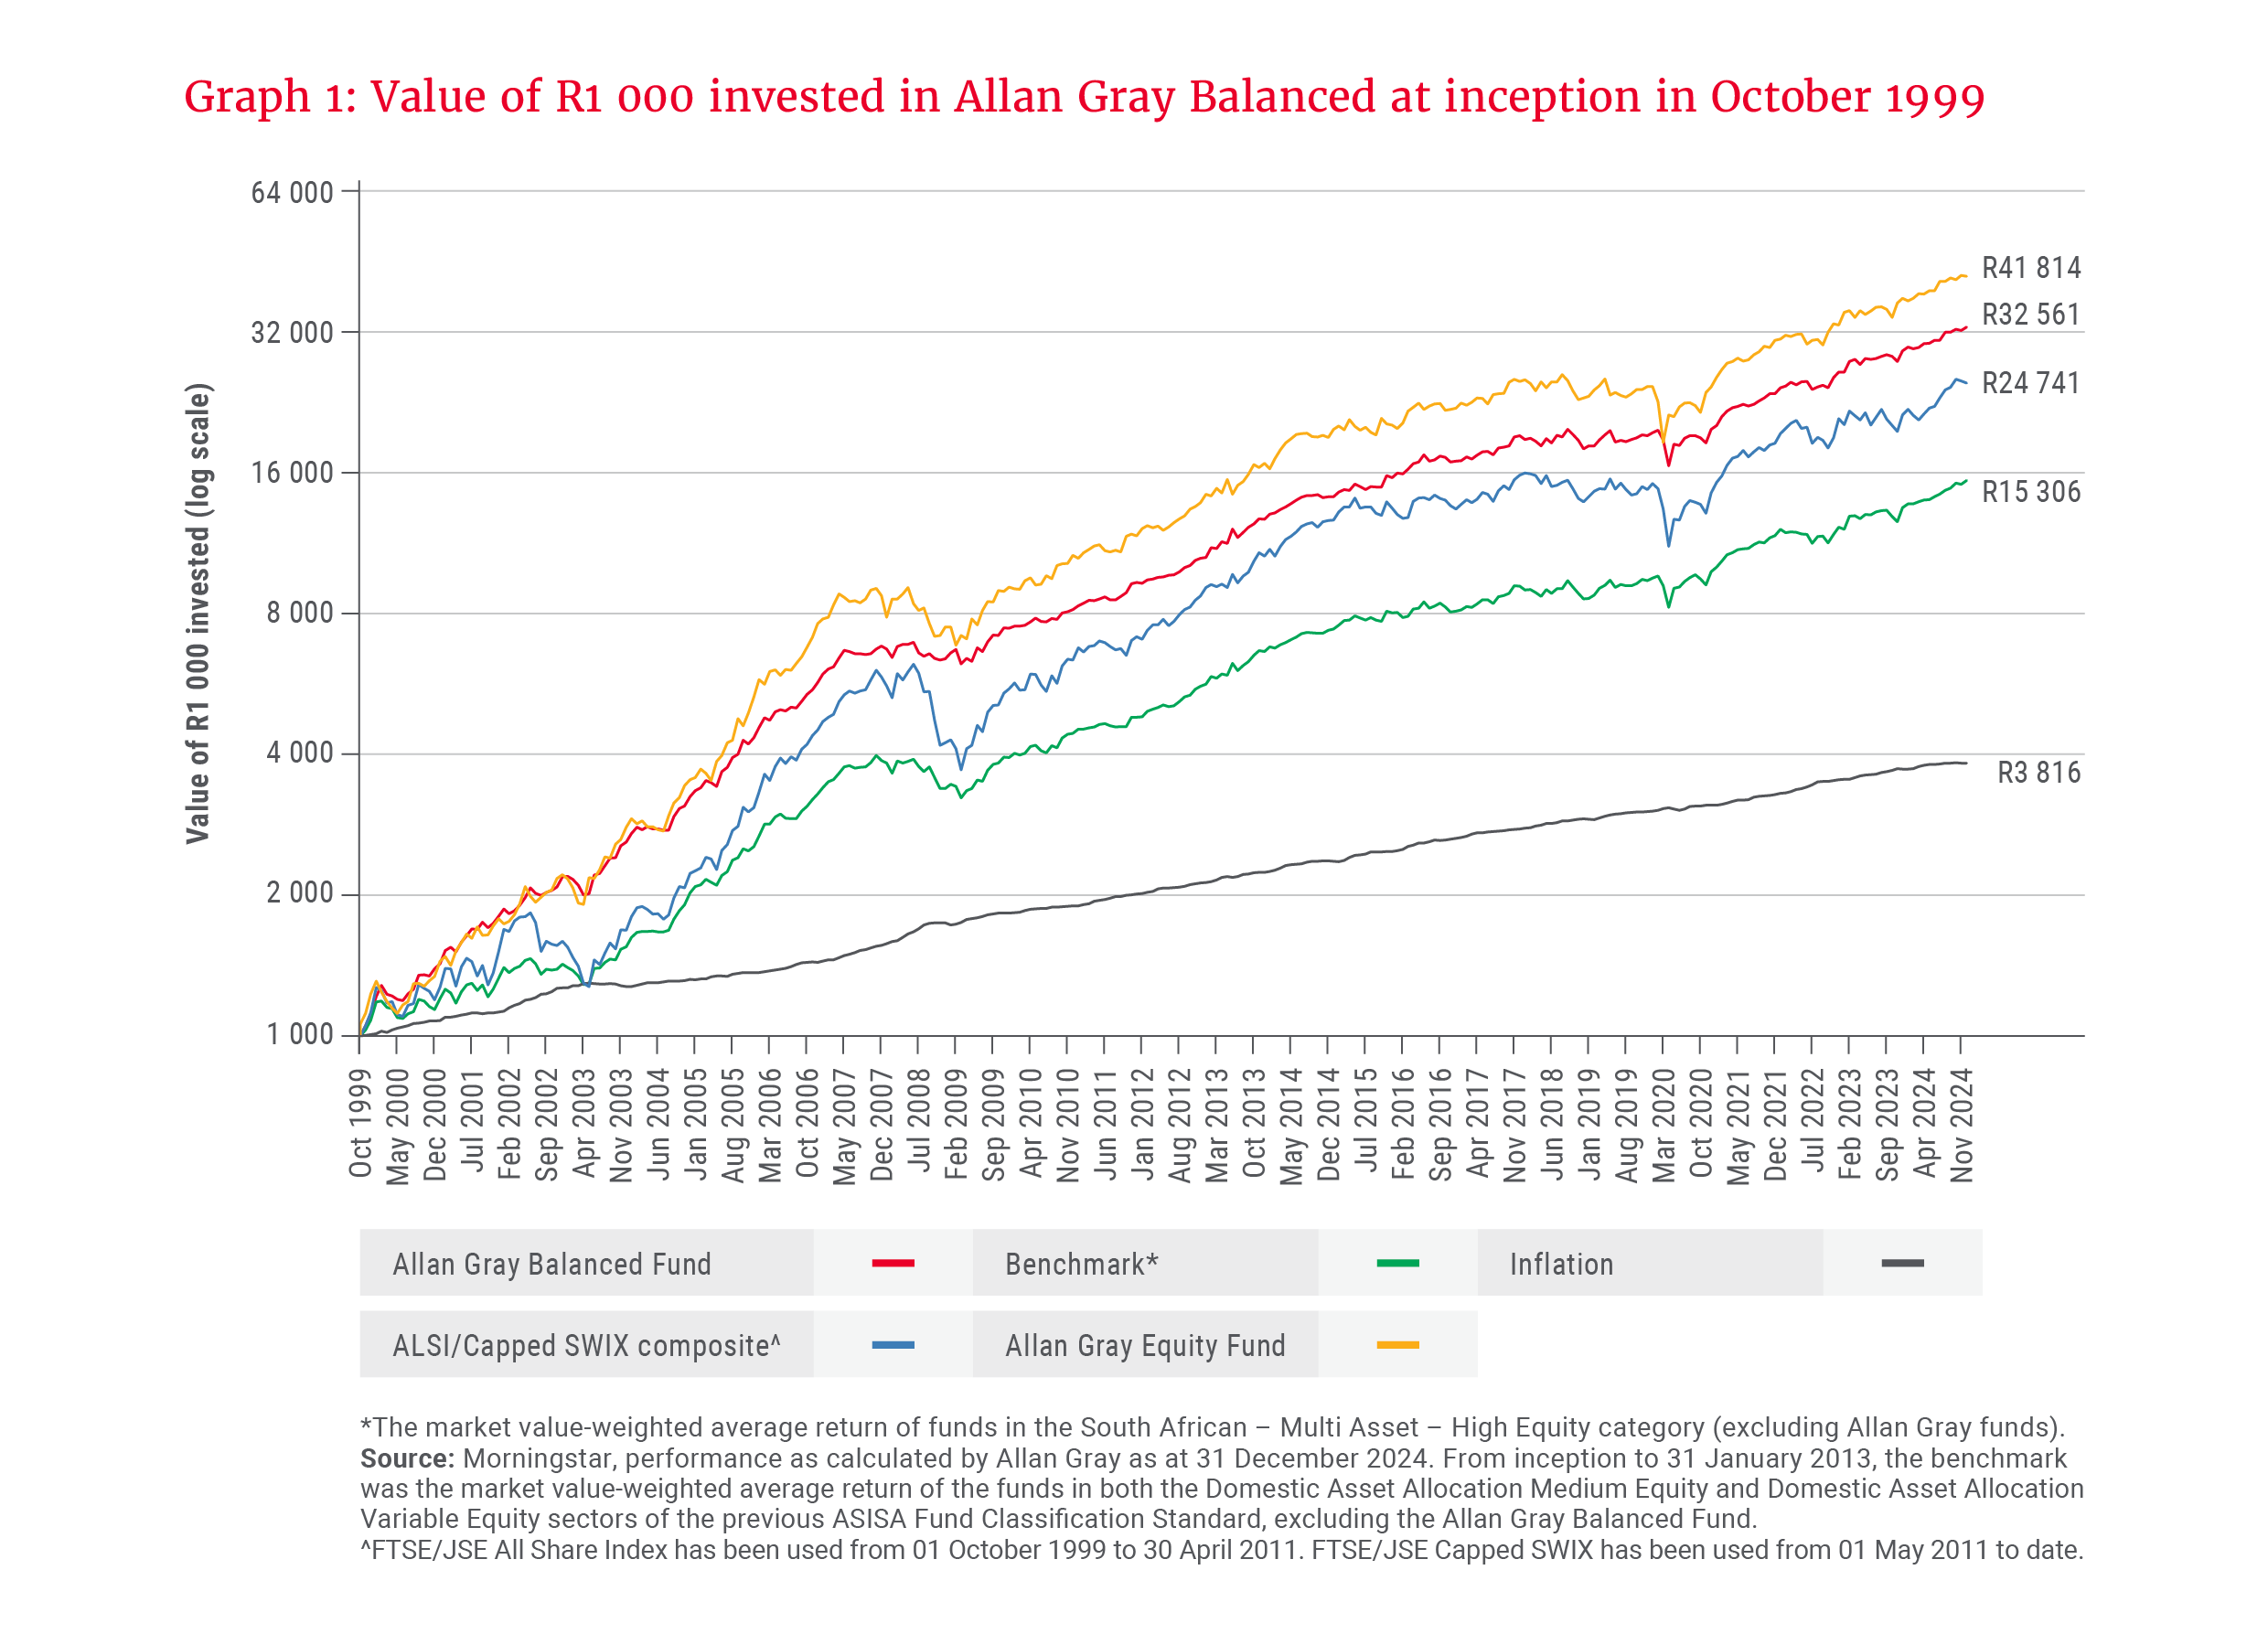
With an average inflation rate of 5.5% over this period, the inflation-beating real return earned by investors from balanced funds in general, and the Allan Gray Balanced Fund in particular, has been significant. It is no surprise, then, that the sector has grown as it has, given that investors have generally been very well served by these strategies. We believe that alternative approaches to client investment solutions (e.g. using specialist asset class building blocks) will find it difficult to compete with well-managed balanced funds over the full investment cycle.
The competitor landscape
Interestingly, while the unit trust industry had already grown substantially to 260 funds managing R117bn in total by 1999, in hindsight, the industry was still in its infancy. By September 2024, there were 1 856 funds (including 449 funds of funds) managing a total of R3 795bn. The Allan Gray Balanced Fund is one of 269 funds that sit in the South African – Multi Asset – High Equity category. (This reduces to 135 funds when we remove the various funds of funds and multimanager offerings from the data.)
While there is a clear proliferation of funds in the category today, there are not many that have what we would consider to be a meaningful track record. Key criteria here include:
- The number and variety of market environments and investment cycles navigated
- The degree to which succession across generations has been achieved, mitigating key person risk concerns
- The number of different business cycles that have been endured and the impact this may have had on organisational stability (the savings industry is notoriously unforgiving when shorter-term investment performance is poor)
While we fully support intense competition in any marketplace and are encouraged by (and encouraging of) the growing number of options available to investors and advisers, we also believe that longevity offers a competitive advantage, provided the organisation is appropriately designed to capture it. In reality, despite the large number of balanced fund offerings, we believe that the tried-and-tested skill set required to effectively manage a balanced strategy is much scarcer than it might at first appear, as is evident in Graph 2, which shows a stark difference between funds with a 20-year track record (the dark grey bar) and the rest of the industry.
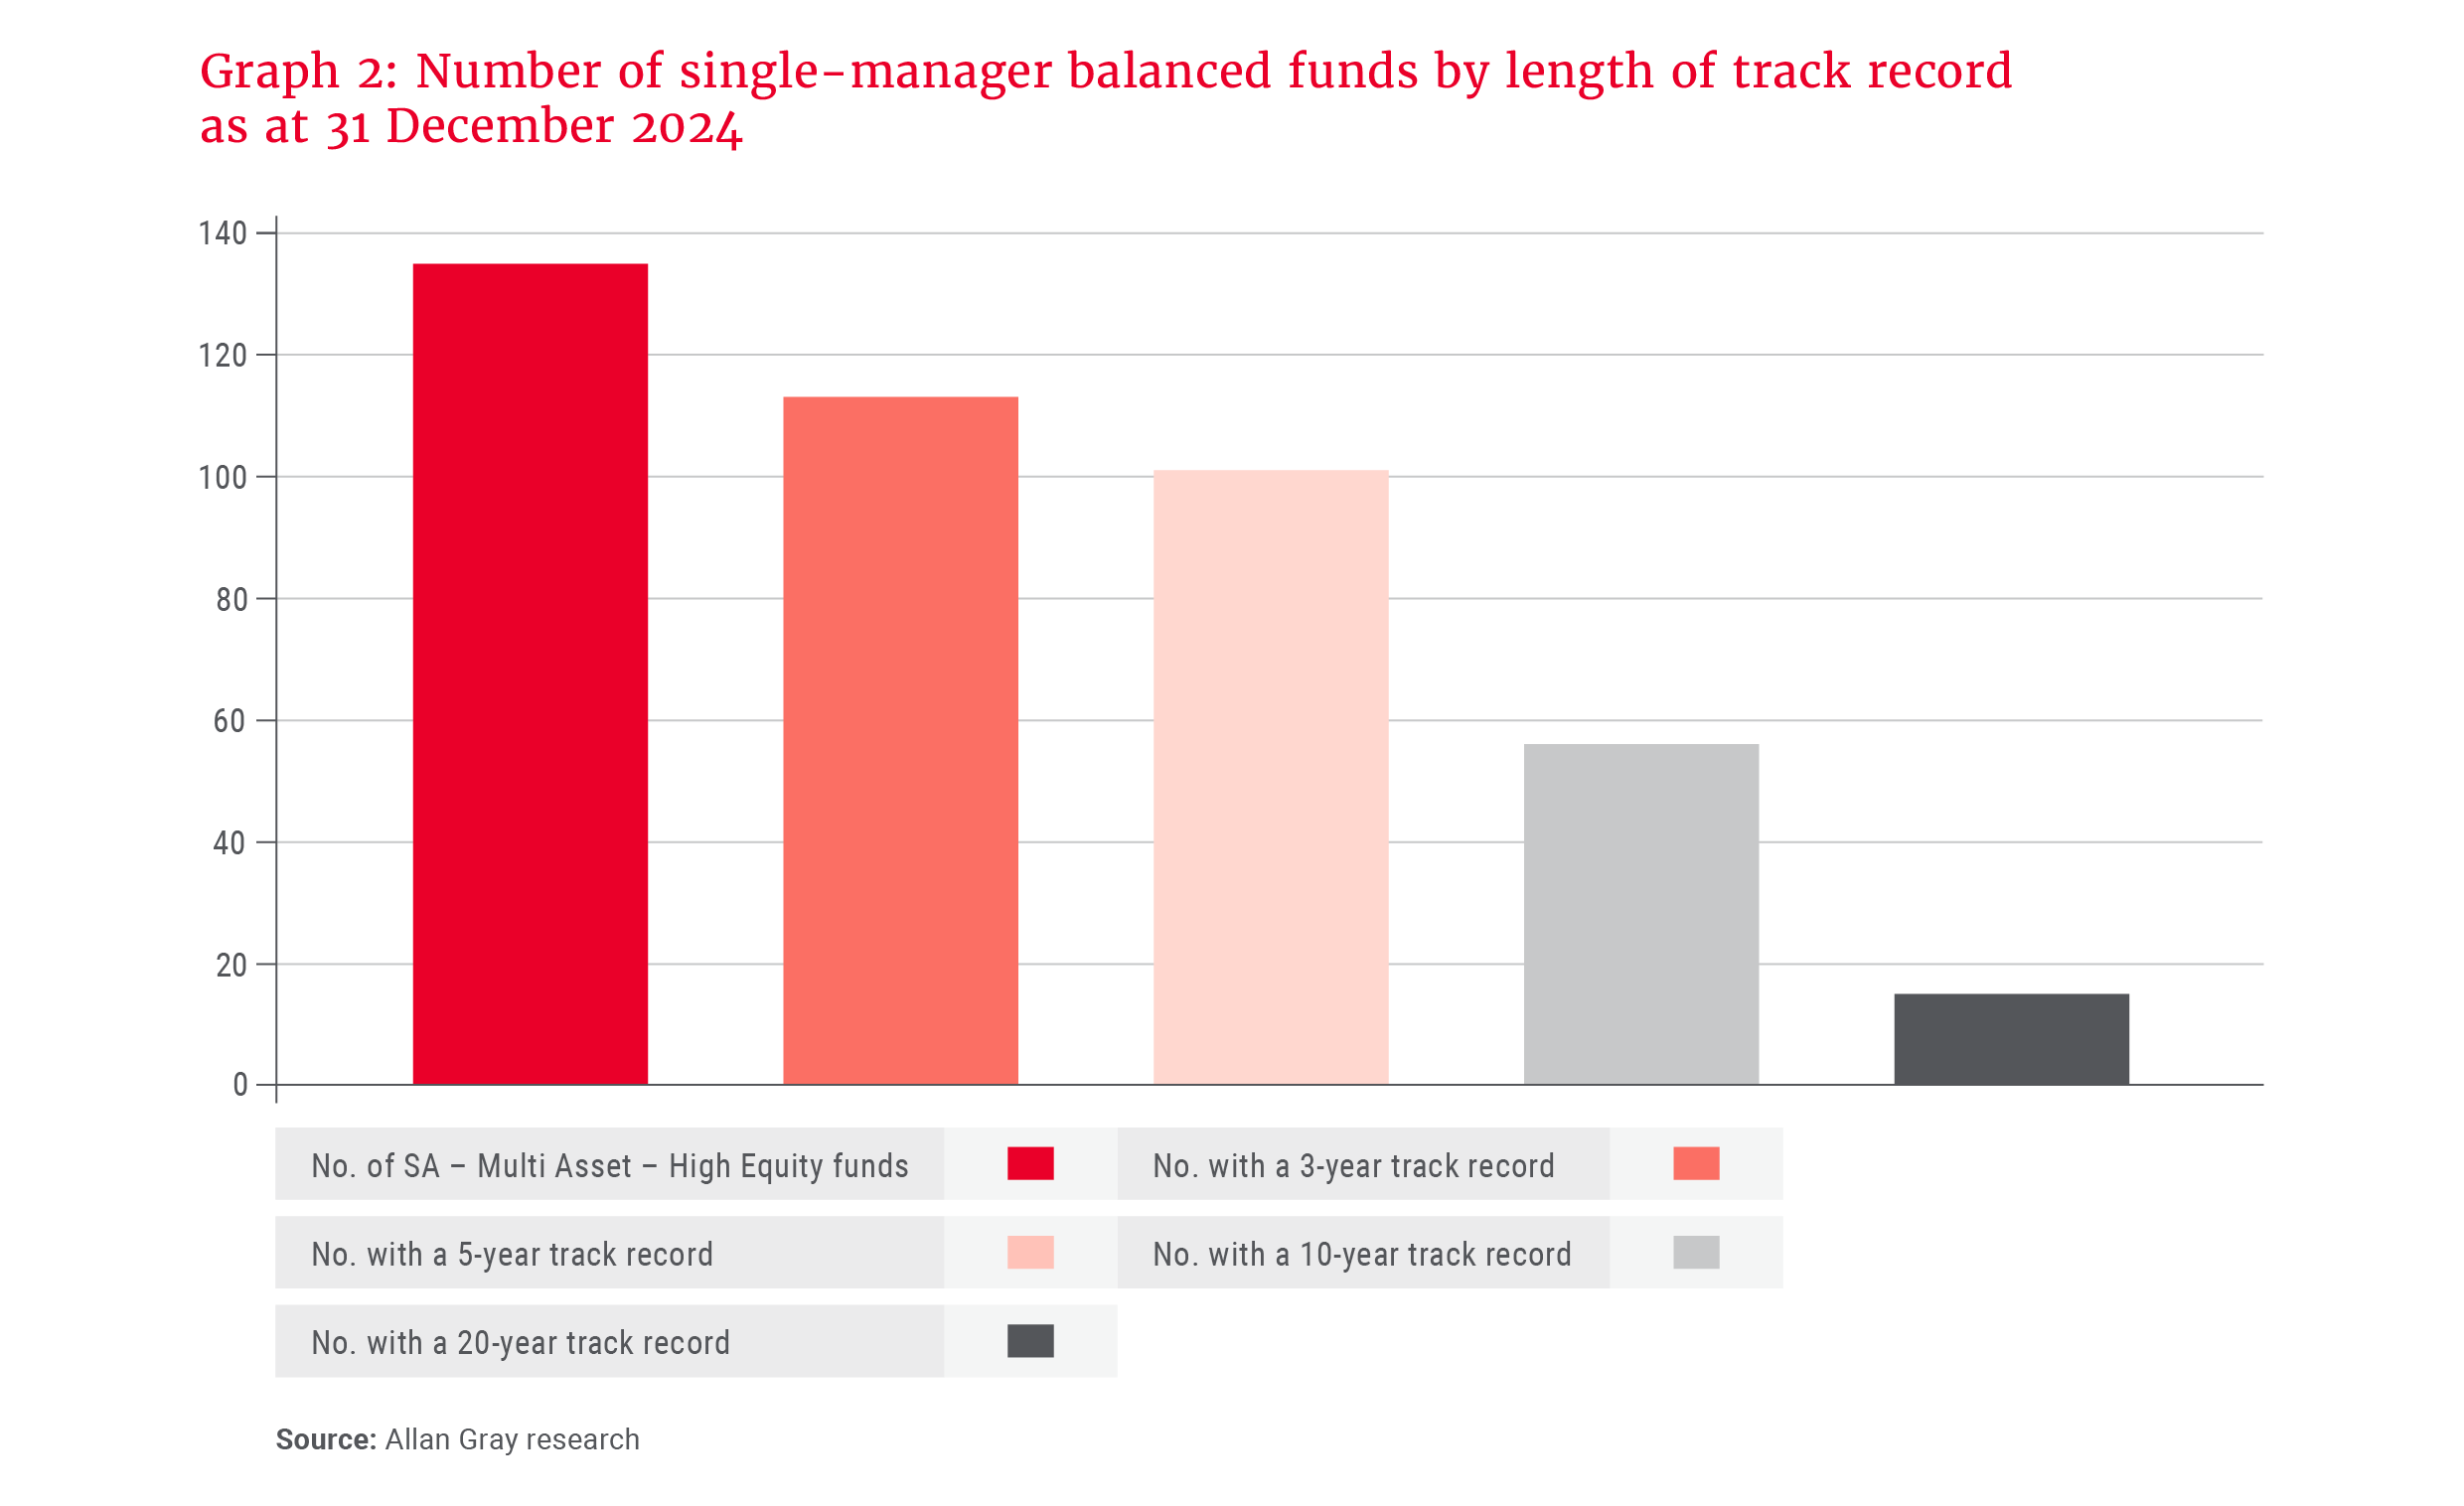
While simply having a long track record doesn’t necessarily make the offering superior, it is nonetheless interesting to note how sharply the number tails off beyond the 5-year track record mark. To the extent that an organisation has remained largely the same, the ability to interrogate performance through several cycles and market environments should provide investors with some additional comfort.
Allan Gray’s ability to deliver on a globally integrated, diversified investment strategy has never been stronger than it is today.
Importantly, while newer start-ups might have some “blank canvas” advantage, we have not been standing still. Allan Gray’s ability to deliver on a globally integrated, diversified investment strategy has never been stronger than it is today. Over five decades of experience through several generations of portfolio managers from Allan Gray and our offshore partner, Orbis, has fortified our global balanced competitive edge. A case in point is the recent investment process enhancements following the increased foreign assets allowance (to 45%), whereby the Allan Gray portfolio managers in Cape Town are directly managing a portion of the foreign assets to better complement the Orbis (foreign) and Allan Gray (South African) holdings.
Notwithstanding the smaller cohort with a track record going as far back as October 1999 (12 funds), Allan Gray has continued to deliver strong relative performance even as this peer group has grown to 135 funds as at December 2024, as shown in Graph 3. We intend for this to continue.
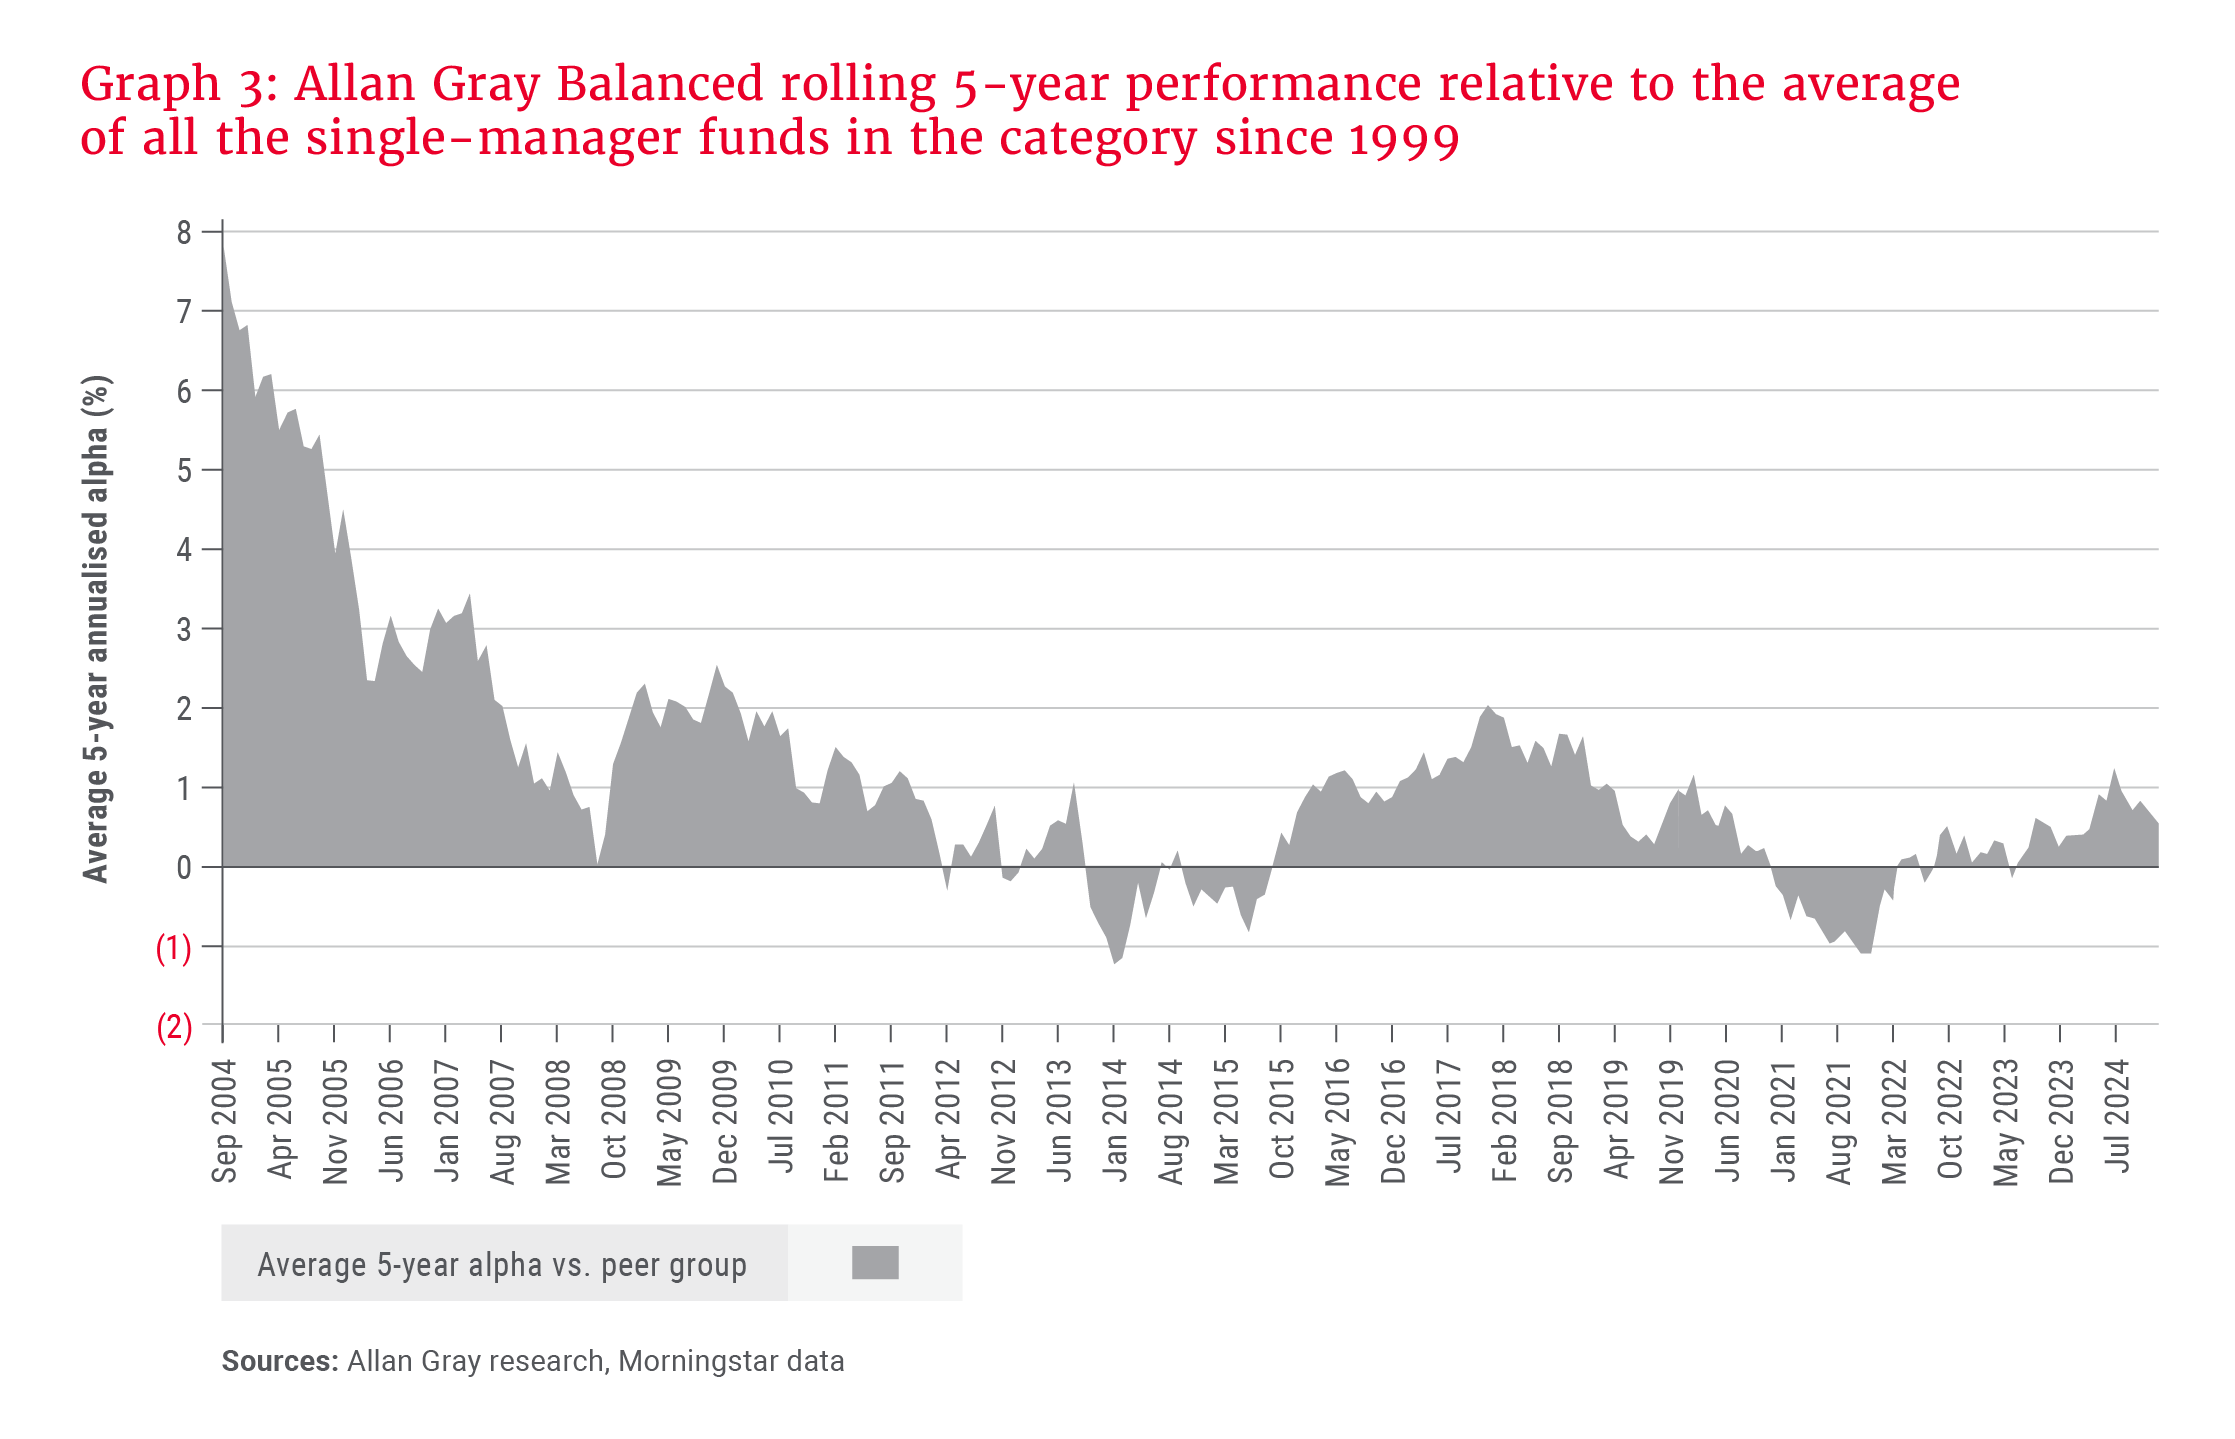
The shaded area in Graph 3 shows Allan Gray’s rolling 5-year annualised performance relative to the average of all the other single-manager funds in the category from October 1999. Wherever the shaded area is above the horizontal axis (0% line), it means that Allan Gray has outperformed over five years to that point in time.
There are generally two key observations from any analysis of Allan Gray’s long-term track record:
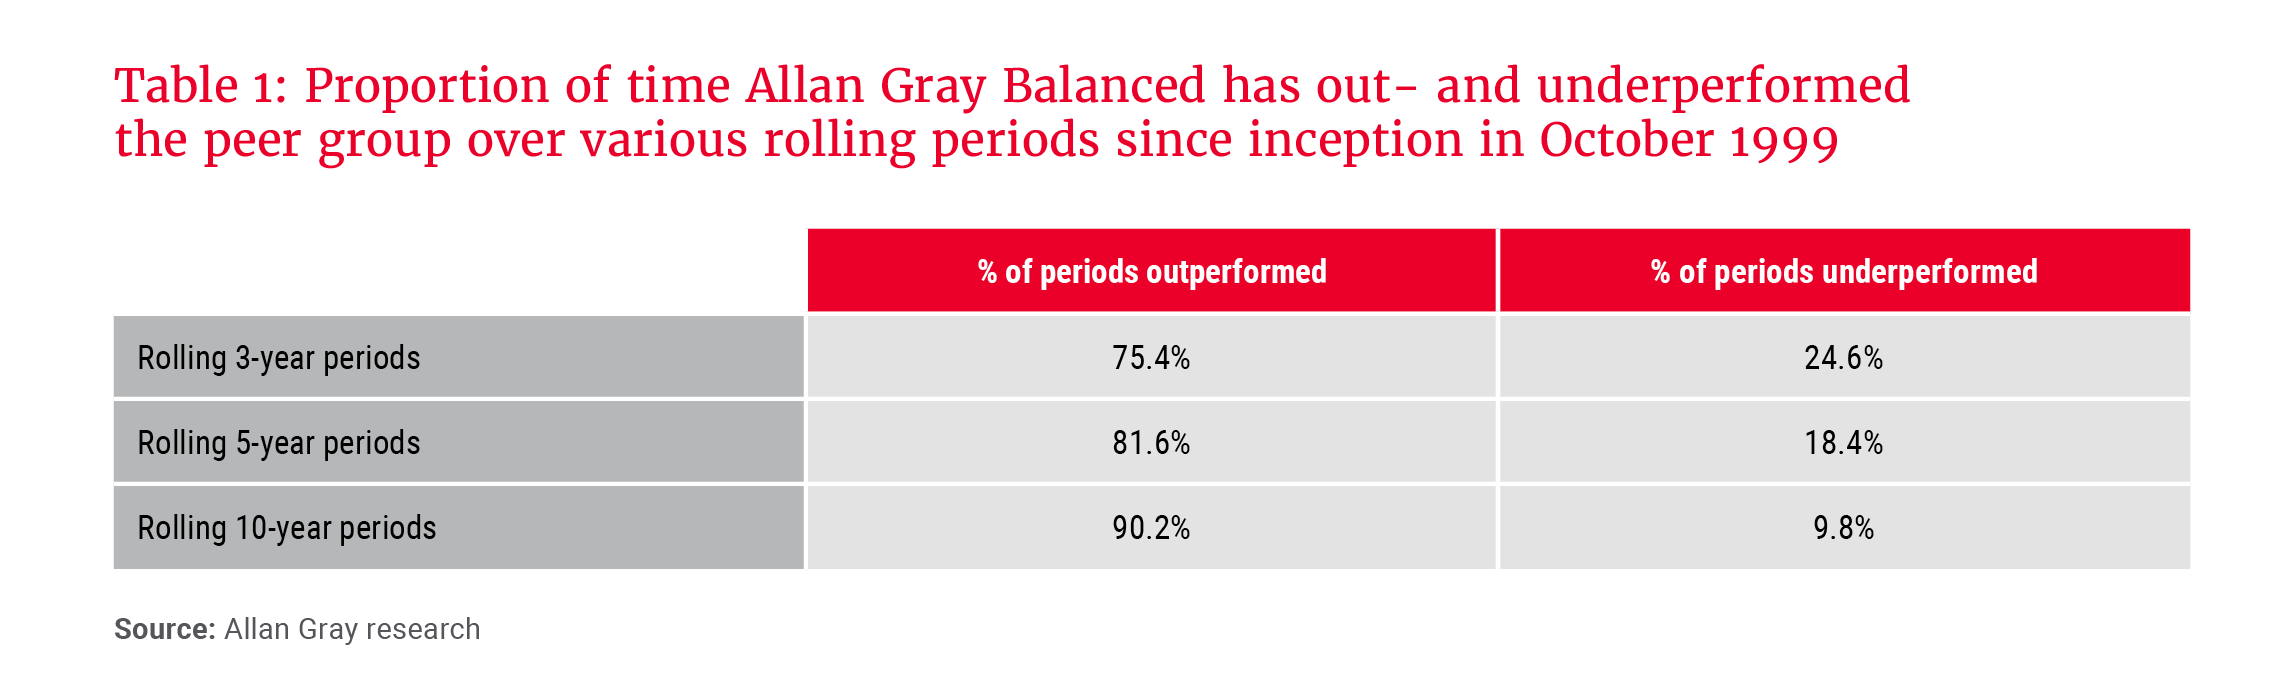
- While the Fund experienced very strong relative performance in its early years, bolstering its long-term track record, it is evident that over most rolling 5-year periods, its relative performance has been consistently better on average (there is a far greater shaded area above the 0% line than below). Table 1 provides a summary of this metric over rolling 3-, 5- and 10-year measurement periods.
In simple terms, an investor looking at the 5-year return at the end of every month from September 2004 (first 5-year period since inception in October 1999) to December 2024 would have seen outperformance of the peers 81.6% of the time. Rolling 3-year periods are slightly lower at 75.4%, and rolling 10-year periods slightly higher at 90.2% of the time. We think this is a compelling success rate.
While periods of underperformance do happen, they are relatively infrequent over the longer time periods that really matter. This is partly why we so often remind investors of the importance of staying invested through short-term market cycles. - When we break this analysis down further, Allan Gray tends to outperform and underperform different managers at various points in time. This supports the assertion that we tend to be an excellent stand-alone option for investors, as well as a great diversifier for those who use multiple managers (we are contrarian and often positioned differently). We explore this further in the following section.
Why Allan Gray Balanced should be in everyone’s manager mix
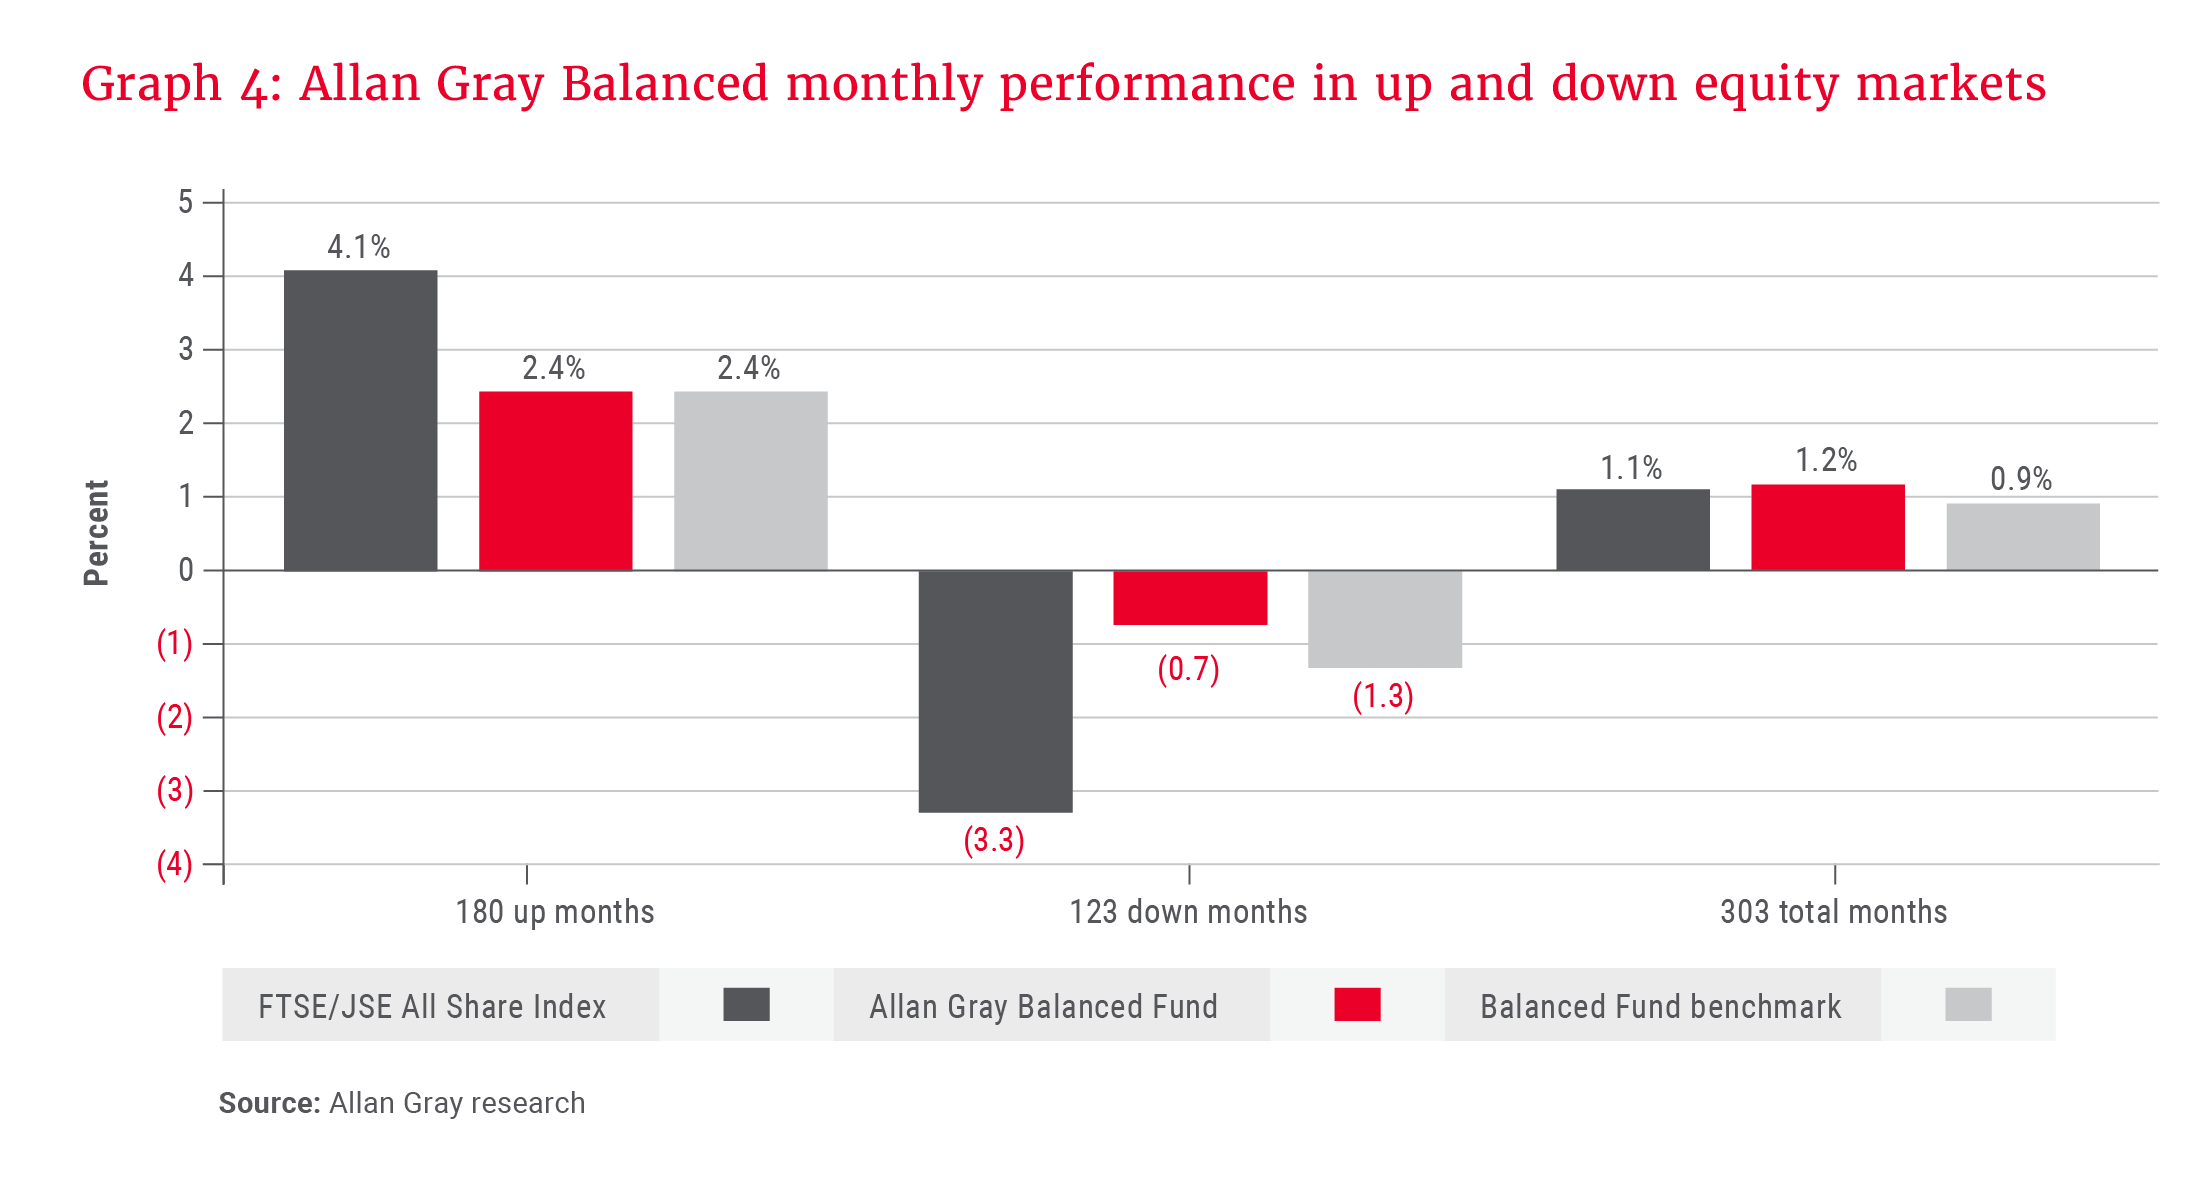
Allan Gray tends to outperform the pack during weaker market periods (down months) when risk is biting, and generally performs in line with peers when markets are strong (up months). The compounding effect of losing less than others during down markets is extremely powerful over time, as seen in Graph 4. The total months’ view reveals that we perform in line with the FTSE/JSE All Share Index (ALSI) over time, despite taking on much less risk, which has not been the case for the peer group average.
This pattern is often misconstrued by some to mean that we simply run a lower-risk portfolio than others and therefore hold up better during market downturns. If this were the case, we would expect to see lower-than-average volatility (as a proxy for risk) over time, but also lower-than-average returns. However, this is not the case. In fact, the portfolios we construct have been (on average) more efficient in terms of the interplay between risk and return over time. Put differently, we typically have delivered more return per unit of risk (when defined as volatility) taken than most others.
Our investment philosophy of only investing in assets where there is a significant margin of safety built into the valuation – i.e. a significant gap between the share price and what we believe the share is worth – and our obsession with trying to avoid the risk of permanent capital loss entirely mean that there is a built-in risk-management anchor to everything we do. It is endemic to how we think about investing. Therefore, while we don’t really think about risk as volatility (but the industry does), the performance pattern outcome, whereby we typically deliver higher-than-average returns, at lower-than-average risk, is entirely intuitive to us.
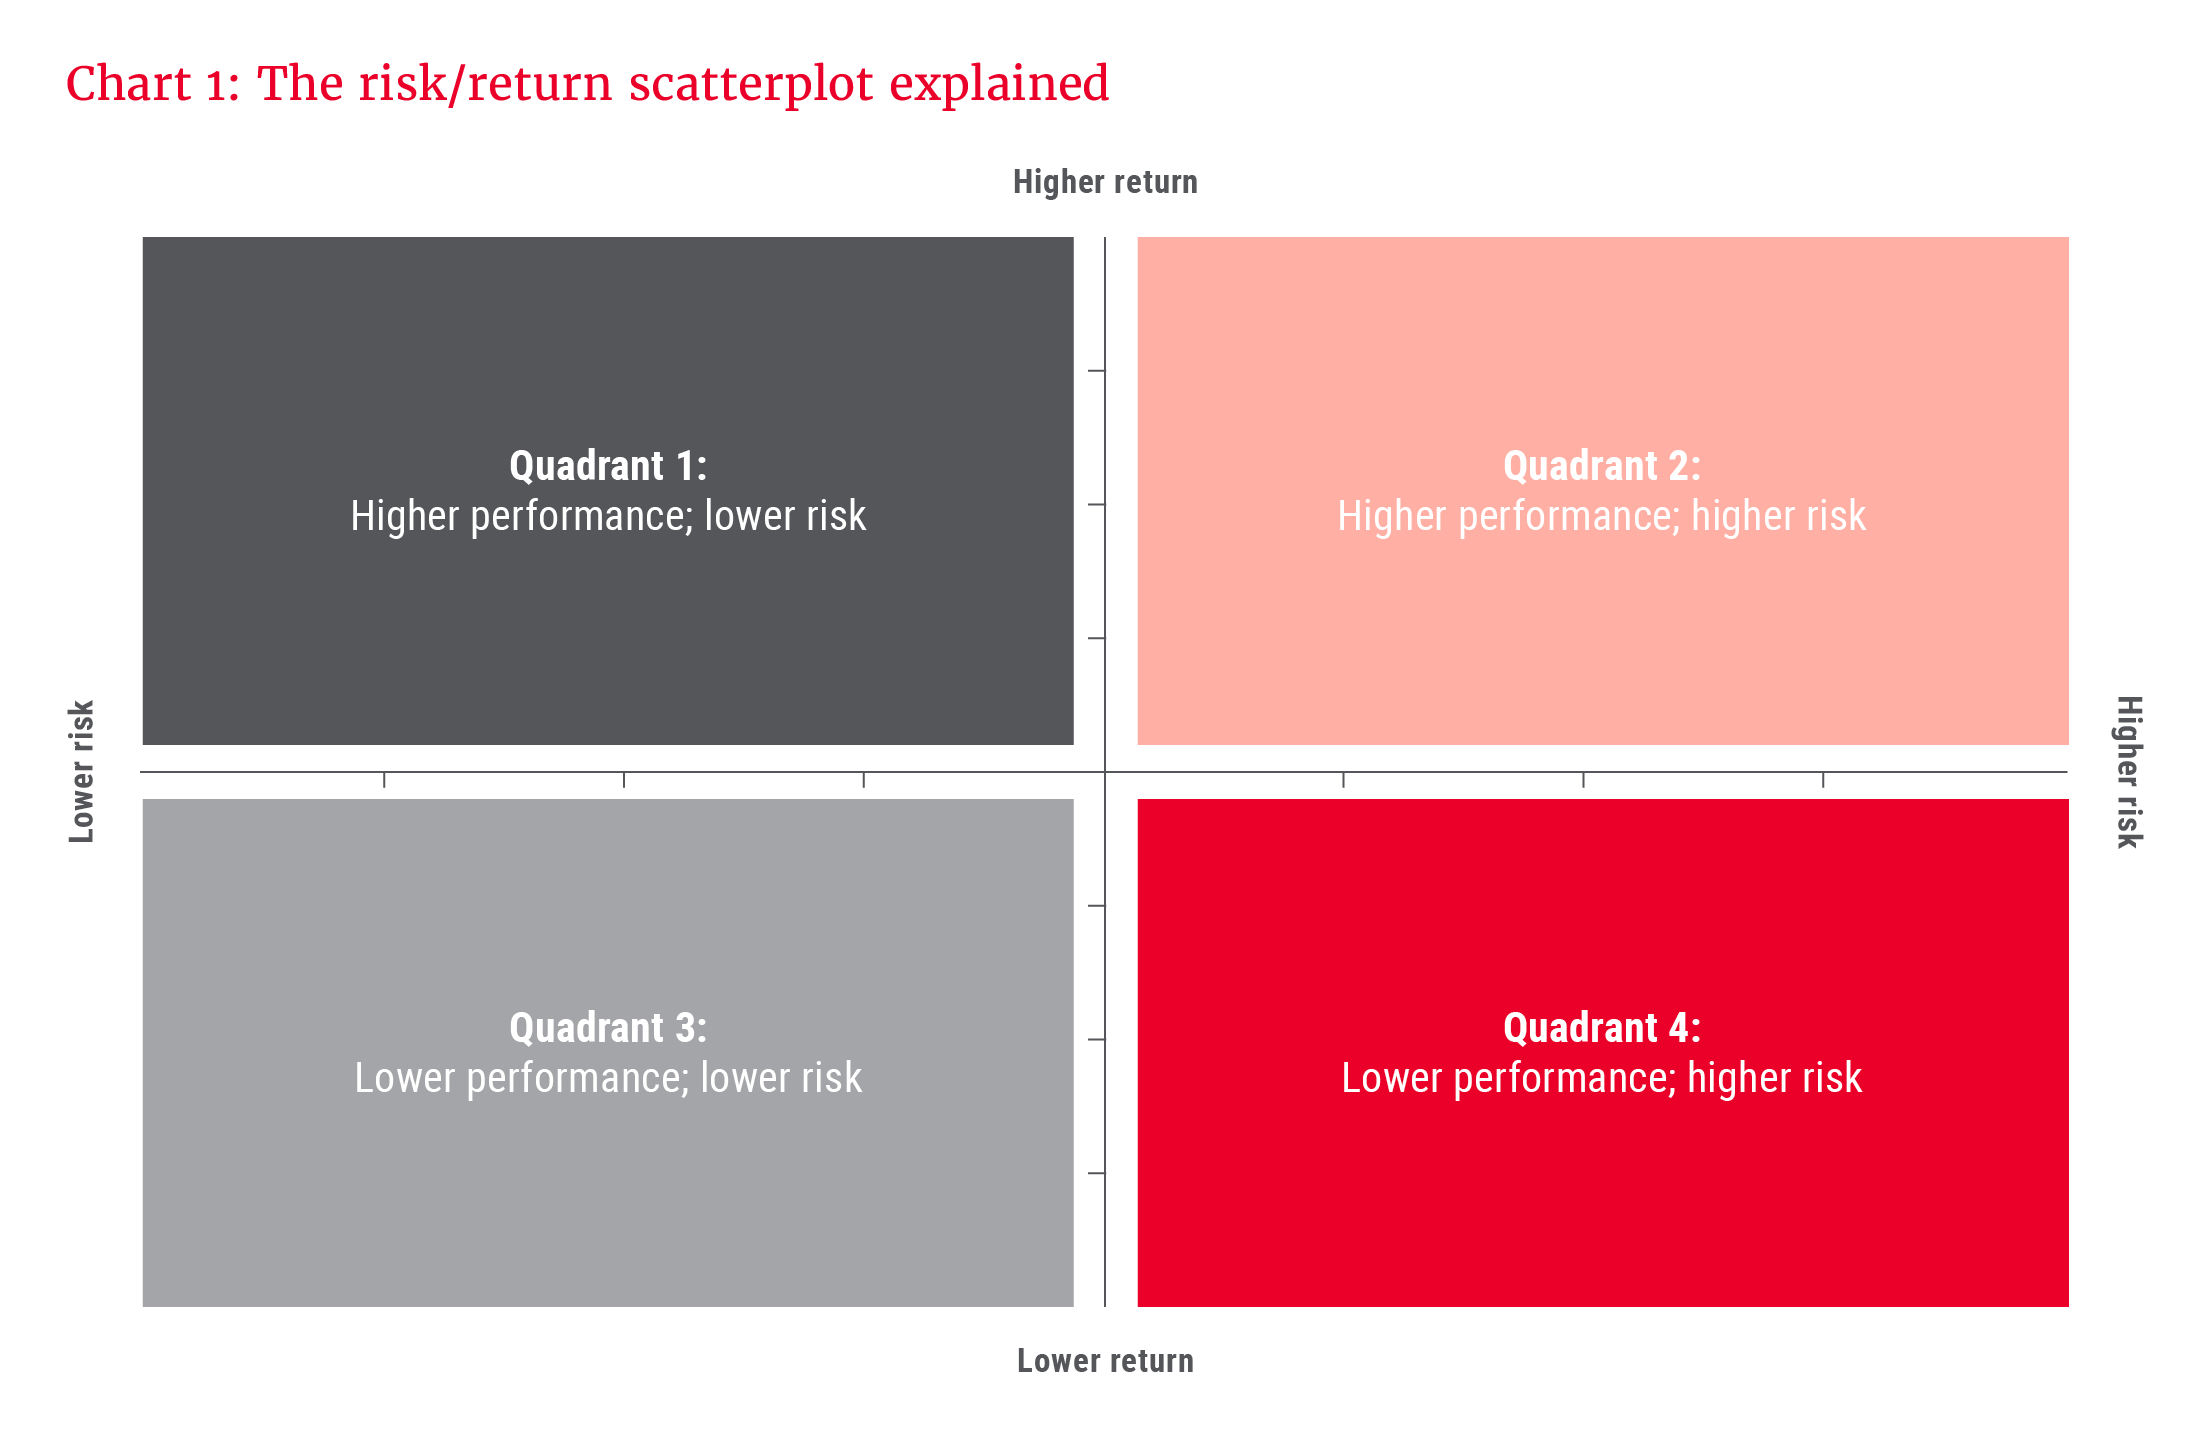
Chart 1 introduces this conceptual interplay between risk/volatility and return. The centre point represents the average risk/return plot of the peer group. Ideally, as an asset manager, we want to be positioned above the horizontal axis (higher-than-average returns) and to the left of the vertical axis (lower-than-average risk/volatility). Therefore, the top left quadrant (dark grey) is the sweet spot, showing higher-than-average returns with less-than-average risk. The bottom right quadrant (red) is not a good area to be in, indicating lower returns and higher risk. The bottom left and top right quadrants (neutral) have either lower risk or higher returns, but not both.
Graph 5 shows the actual Allan Gray Balanced Fund risk/return plots relative to the peer group average (the centre point, where the two axes intercept) for various rolling periods (shifted monthly) from inception in October 1999 to December 2024. The graph shows this as the percentage of time for each measurement period that the Fund fell into each of the four quadrants over its 25-year history.
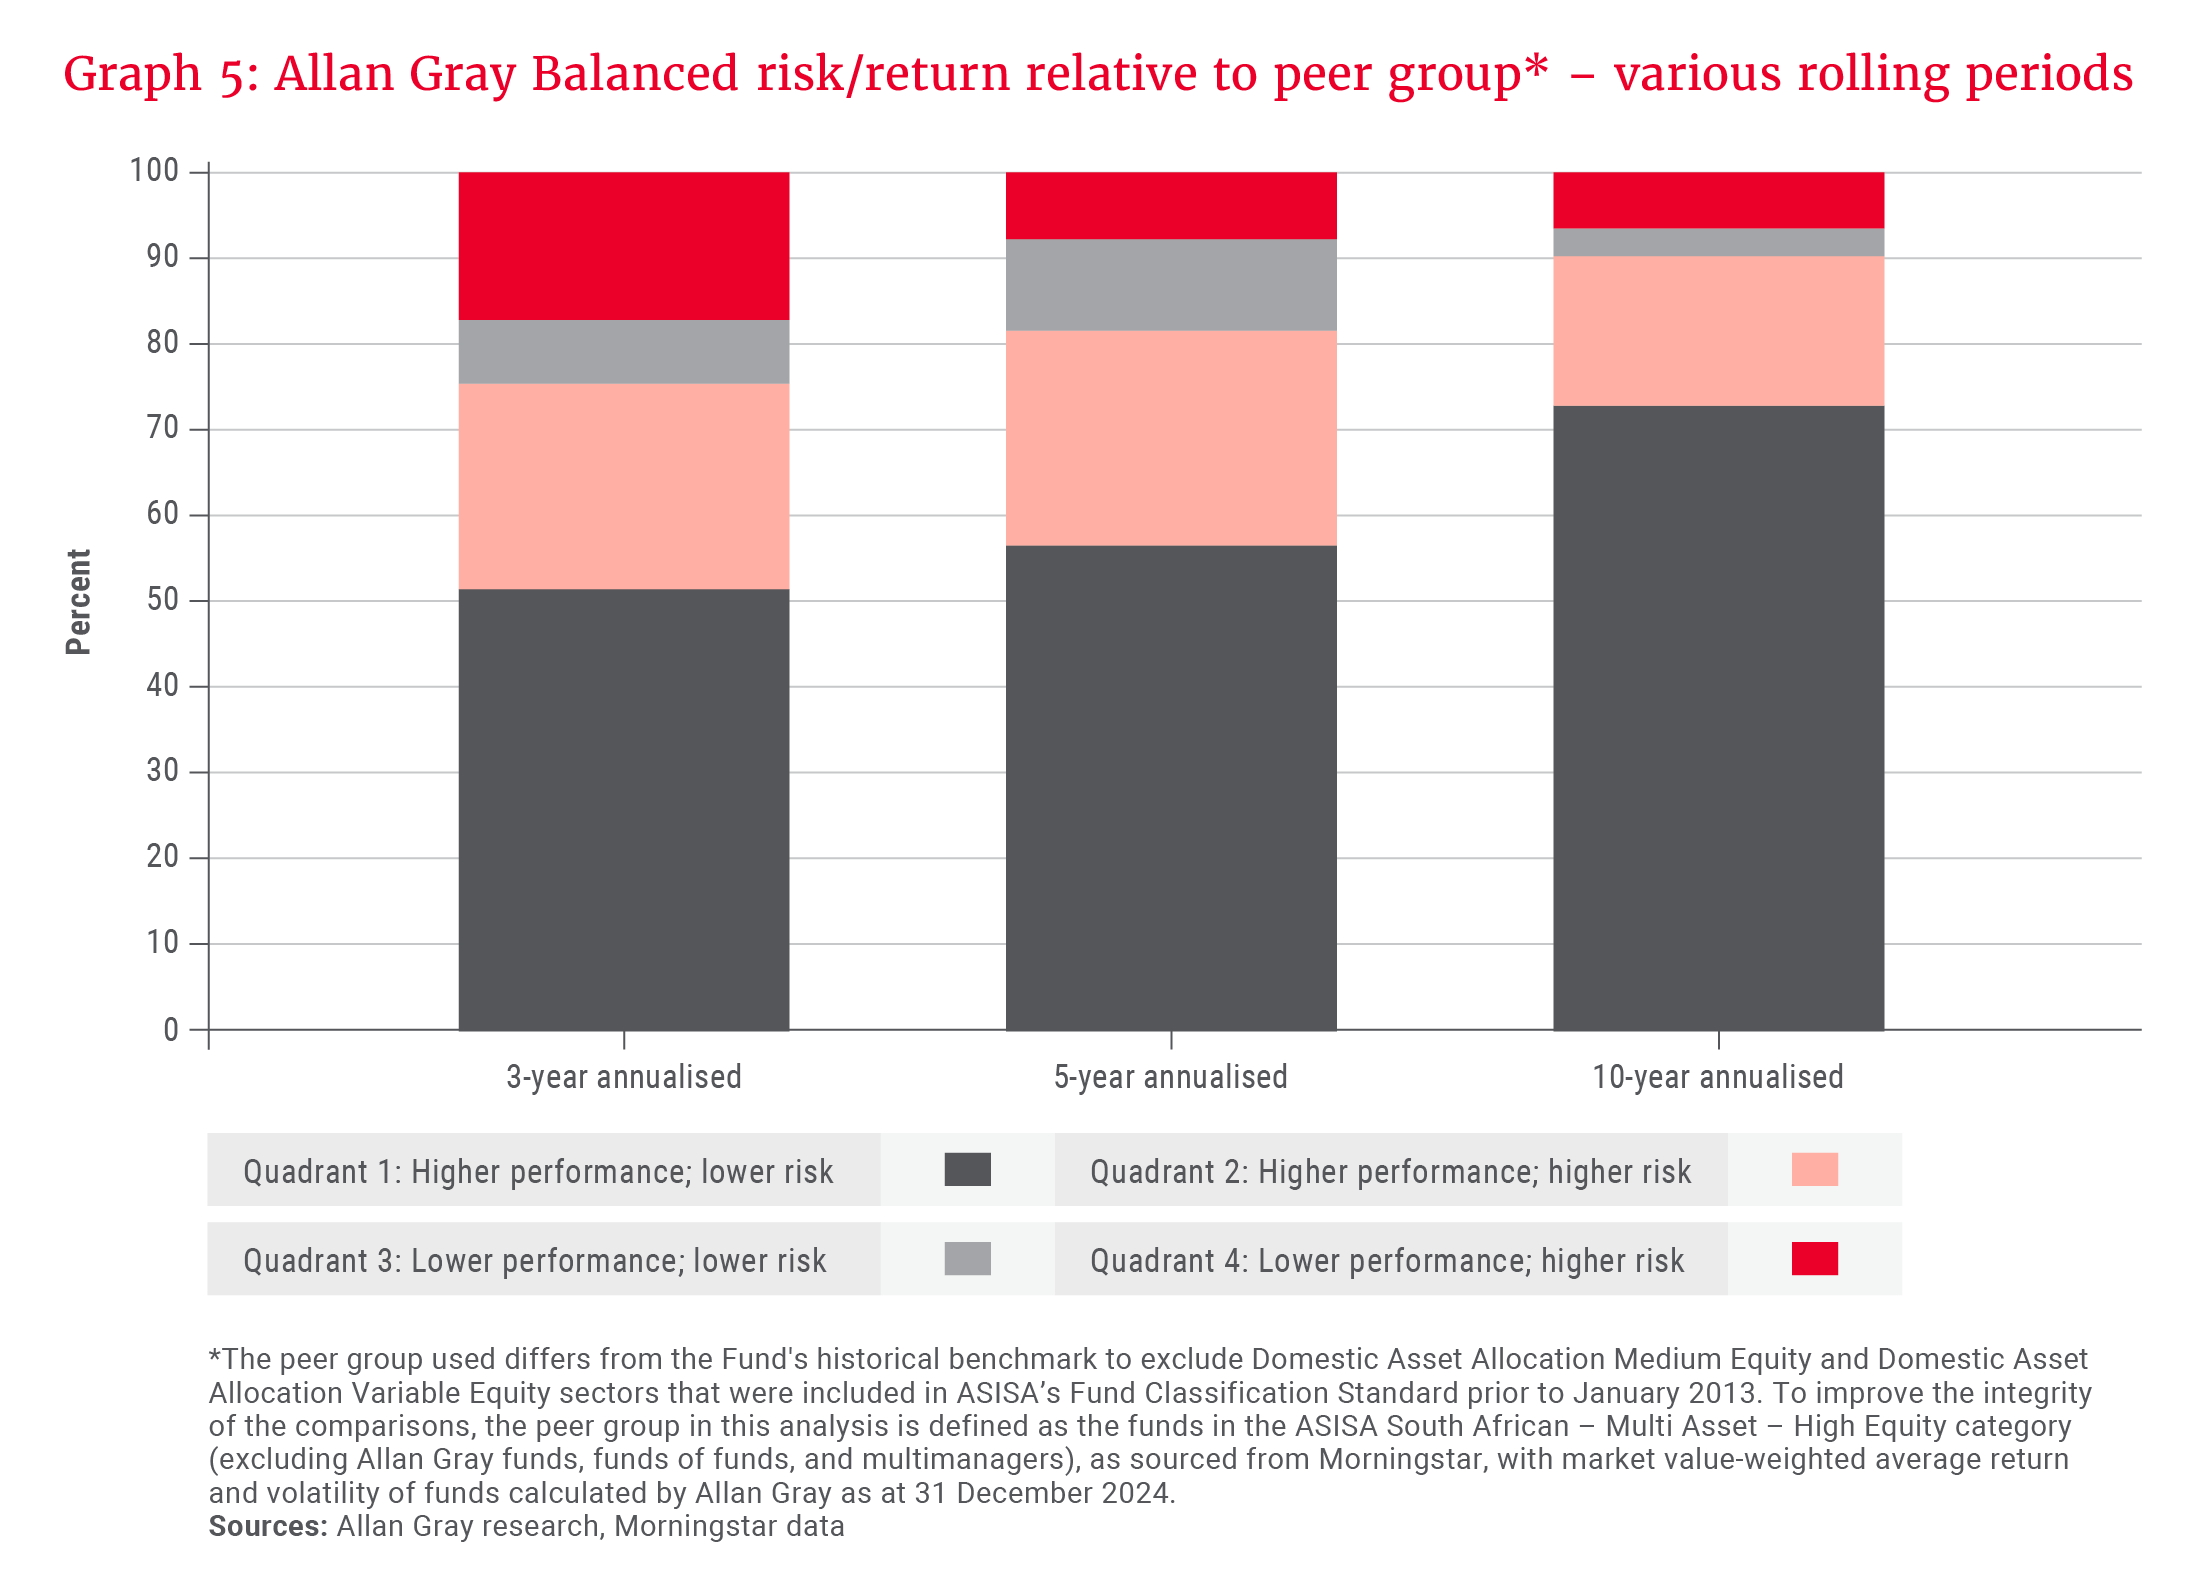
Some key observations stand out in this graph. When measured over rolling 3-, 5- and 10-year periods, Allan Gray:
- Plots in quadrant 1 (higher average returns and lower average risk – the “sweet spot”) between 51.5% and 72.8% of the time
- Plots in quadrants 1 or 2 (higher-than-average returns) between 75.4% and 90.2% of the time
- Plots in quadrant 4 (lower returns and higher risk) only between 6.5% and 17.2% of the time
The outcomes improve as the time horizon lengthens from 3-year measurement periods to 10-year measurement periods, reinforcing the importance of staying invested through the short-term cycles.
Balancing risk and return into the future
The Allan Gray Balanced Fund has served investors very well over the last two and a half decades – and we will work tirelessly to continue to do so. Despite the proliferation of offerings in this category over the last decade, we believe that there are very few managers in the sector with the requisite breadth of skills and depth of experience required to manage this strategy successfully into the future.
The growing complexities of combining local and foreign assets, given the nuances of the South African share market, also lead us to believe that a holistic, combined global balanced approach is likely to generate superior risk-adjusted outcomes for South African investors over time, compared to the alternative specialist building-block approach.
Allan Gray’s organisational stability, scale, proven intergenerational succession, tenure through many market cycles and an integrated global capability with Orbis demonstrate a distinct competitive advantage in delivering risk-adjusted returns to investors on a stand-alone basis. Given our performance signature of typically outperforming peers during periods when markets (and other managers) are struggling, it is clear that the Allan Gray Balanced Fund should also be a core component of any multimanaged solution due to its powerful diversification benefits.
Explore more insights from our Q4 2024 Quarterly Commentary:
- 2024 Q4 Comments from the Chief Operating Officer by Mahesh Cooper
- Paying tribute to Gillian Gray by Craig Bodenstab
- Diamonds in the rough: A look at luxury by Jithen Pillay
- Where investors fear to fish by Rory Kutisker-Jacobson
- Orbis: President’s letter 2024 by Adam R. Karr
- How to maximise tax benefits in a two-pot era by Carla Rossouw and Lee Kotze
- How to keep the lid on lifestyle creep by Twanji Kalula
To view our latest Quarterly Commentary or browse previous editions, click here.